Chainlink Price Analysis – August 9
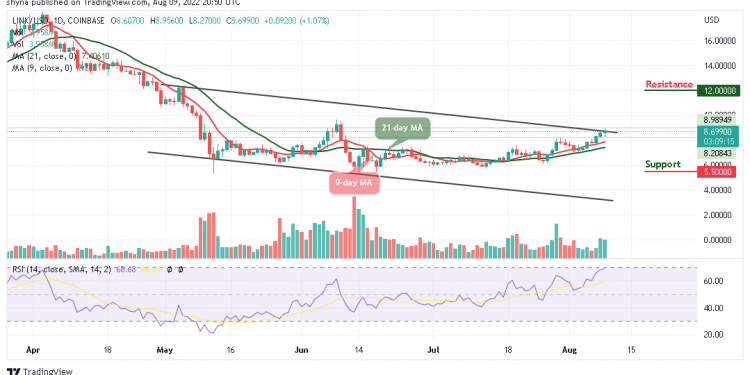
The Chainlink price is up by 1.07% in the past 24 hours, hitting a new daily high at the $8.9 level.
LINK/USD Market
Key Levels:
Resistance levels: $12, $13, $14
Support levels: $5.5, $4.5, $3.5
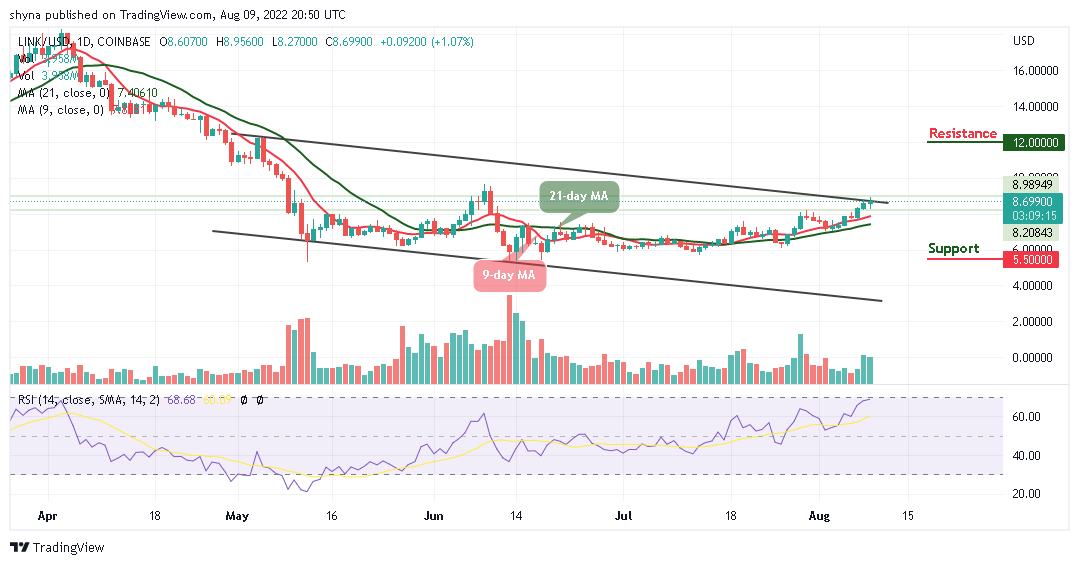
LINK/USD is seen as part of the cryptocurrency that is doing slightly good in the market. Over the past few days, LINK/USD has seen large gains from a low of $8.2 to the current high at $8.95 today. Because this is a new daily high, the bulls may likely push the coin above the upper boundary of the channel.
Chainlink Price Analysis: What Could Be the Next Direction?
From a technical view, the Chainlink price is in the hands of the bulls as the technical indicator Relative Strength Index (14) supports the bullish action with its cross into the overbought region. At the time of writing, buyers may be facing the important $9 resistance level and aiming to hit the potential resistance levels at $12, $13, and $14 shortly, while the supports could be located at $5.5, $4.5, and $3.5 respectively.
LINK/BTC Market: Chainlink Price Consolidates Above the Moving Averages
Compared with BTC, the market price is seen moving above the 9-day and 21-day moving averages and within the channel where the price is expected to break above the upper boundary of the channel. However, if the price breaks to the upside, the LINK price may begin to experience an upward trend which could touch the potential resistance at 4500 SAT and above.
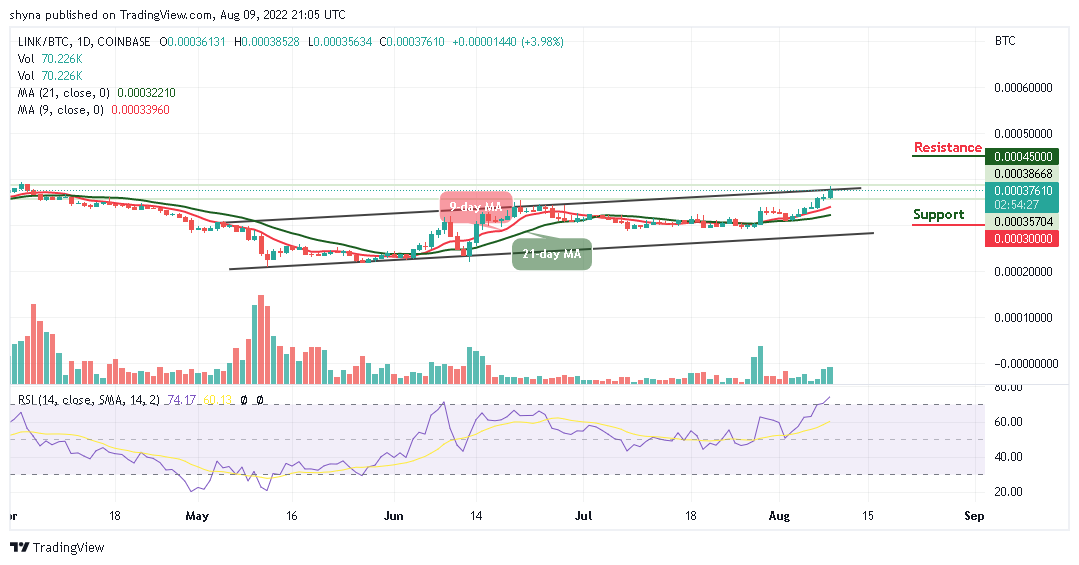
Meanwhile, if the Chainlink price crosses below the moving averages, it may likely reach the support at 3000 SAT and below. However, the technical indicator Relative Strength Index (14) confirms that the market faces the north as the signal line moves above the 40-level into the overbought region, suggesting more bullish signals in the nearest term.


